
Kafka Monitoring & Observability
Unified metrics, logs, and service checks for every Kafka cluster in one platform. Set up monitoring and alerting in seconds, not days.

Unified Kafka observability
Most teams piece together Kafka visibility from multiple tools: broker metrics in Grafana, consumer lag in a separate dashboard, logs in Kibana, and alerts scattered across systems. When something goes wrong, the first task is assembling context rather than fixing the problem. AxonOps brings broker metrics, consumer group lag, logs, service checks, and operational alerts into a single correlated timeline.
Metrics, logs, and consumer lag correlated on one timeline. Go from alert to root cause without switching tools or assembling context manually.
Broker health, KRaft controller state, consumer group lag, connector failures, and service checks all monitored from one platform.
Continuous monitoring across every dimension with alerts routed to the right people when something needs attention.
The most comprehensive monitoring platform for Apache Kafka
Metrics from brokers, KRaft, Connect, Schema Registry, and consumer groups, with logs, health checks, and alerting in one platform.
| Capability | What you get | Detail |
|---|---|---|
| Metrics | ||
| Broker metrics | Request rates, throughput, ISR shrink/expand, under-replicated partitions, network I/O | 5-second collection interval |
| KRaft controller metrics | Controller state, election rates, metadata log lag | Full KRaft support |
| Topic and partition metrics | Per-topic throughput, partition count, log size, retention | Granular topic-level visibility |
| Connect worker metrics | Task status, throughput, error rates, rebalance counts across all Connect workers | Connector-level visibility |
| Schema Registry metrics | Request latency, schema counts, compatibility check rates | Registry health at a glance |
| Consumer group lag | Real-time lag per consumer group, topic, and partition | Alerting on lag thresholds |
| JVM internals | Heap usage, GC pauses, thread counts, buffer pools | Correlated with broker metrics |
| OS telemetry | CPU, memory, disk I/O, network throughput per broker | Infrastructure and application in one view |
| Logs | ||
| Kafka logs | Broker log ingestion with full-text search | Time-aligned with metric anomalies |
| Log-based charts | Create charts from log data and display them alongside metric charts | Correlate log patterns with performance trends |
| Log-based alerting | Define alert rules that trigger on log patterns, frequencies, or error rates | Catch issues that metrics alone cannot surface |
| Health checks | ||
| Service checks | Broker availability, port connectivity, cluster reachability | Configurable intervals and escalation |
| Replica rack placement | Monitors replica distribution across racks and alerts when replicas are not spread across all available racks | Protects against rack-level failures |
| User-definable checks | Custom health checks tailored to your environment and applications | Scriptable checks with configurable thresholds |
| Alerting & routing | ||
| Resource thresholds | Disk space, CPU saturation, memory utilization | Per-broker alerting with severity levels |
| Alert routing | Route by metric, cluster, or severity | PagerDuty, Slack, Teams, email, webhooks |
| Long-term retention | Weeks or months of metric history | Capacity planning and SLA reporting |
| Integrations | ||
| PromQL-compatible API | Query AxonOps metrics using standard PromQL from Grafana or any compatible tool | No data duplication required |
| Enterprise dashboard integration | Expose Kafka metrics to existing Grafana, Datadog, or custom dashboards | Fits into your existing observability stack |
| Alert delivery channels | Slack, Microsoft Teams, ServiceNow, PagerDuty, OpsGenie, Generic Webhook, Custom SMTP, Email | Route to existing incident workflows |
| Governance | ||
| Role-based access | Assign edit or read-only rights per user, with access scoped to specific clusters | Prevent unauthorized changes |
| SSO authentication | Optional Enterprise SAML integration for single sign-on | Centralized identity management |
| Audit history | Full log of configuration changes, alert rule updates, and dashboard modifications | Who changed what and when |
| Automation | ||
| Terraform provider | Automate alert rules, notification channels, and adaptive alert routing as code | Codify your Kafka observability |
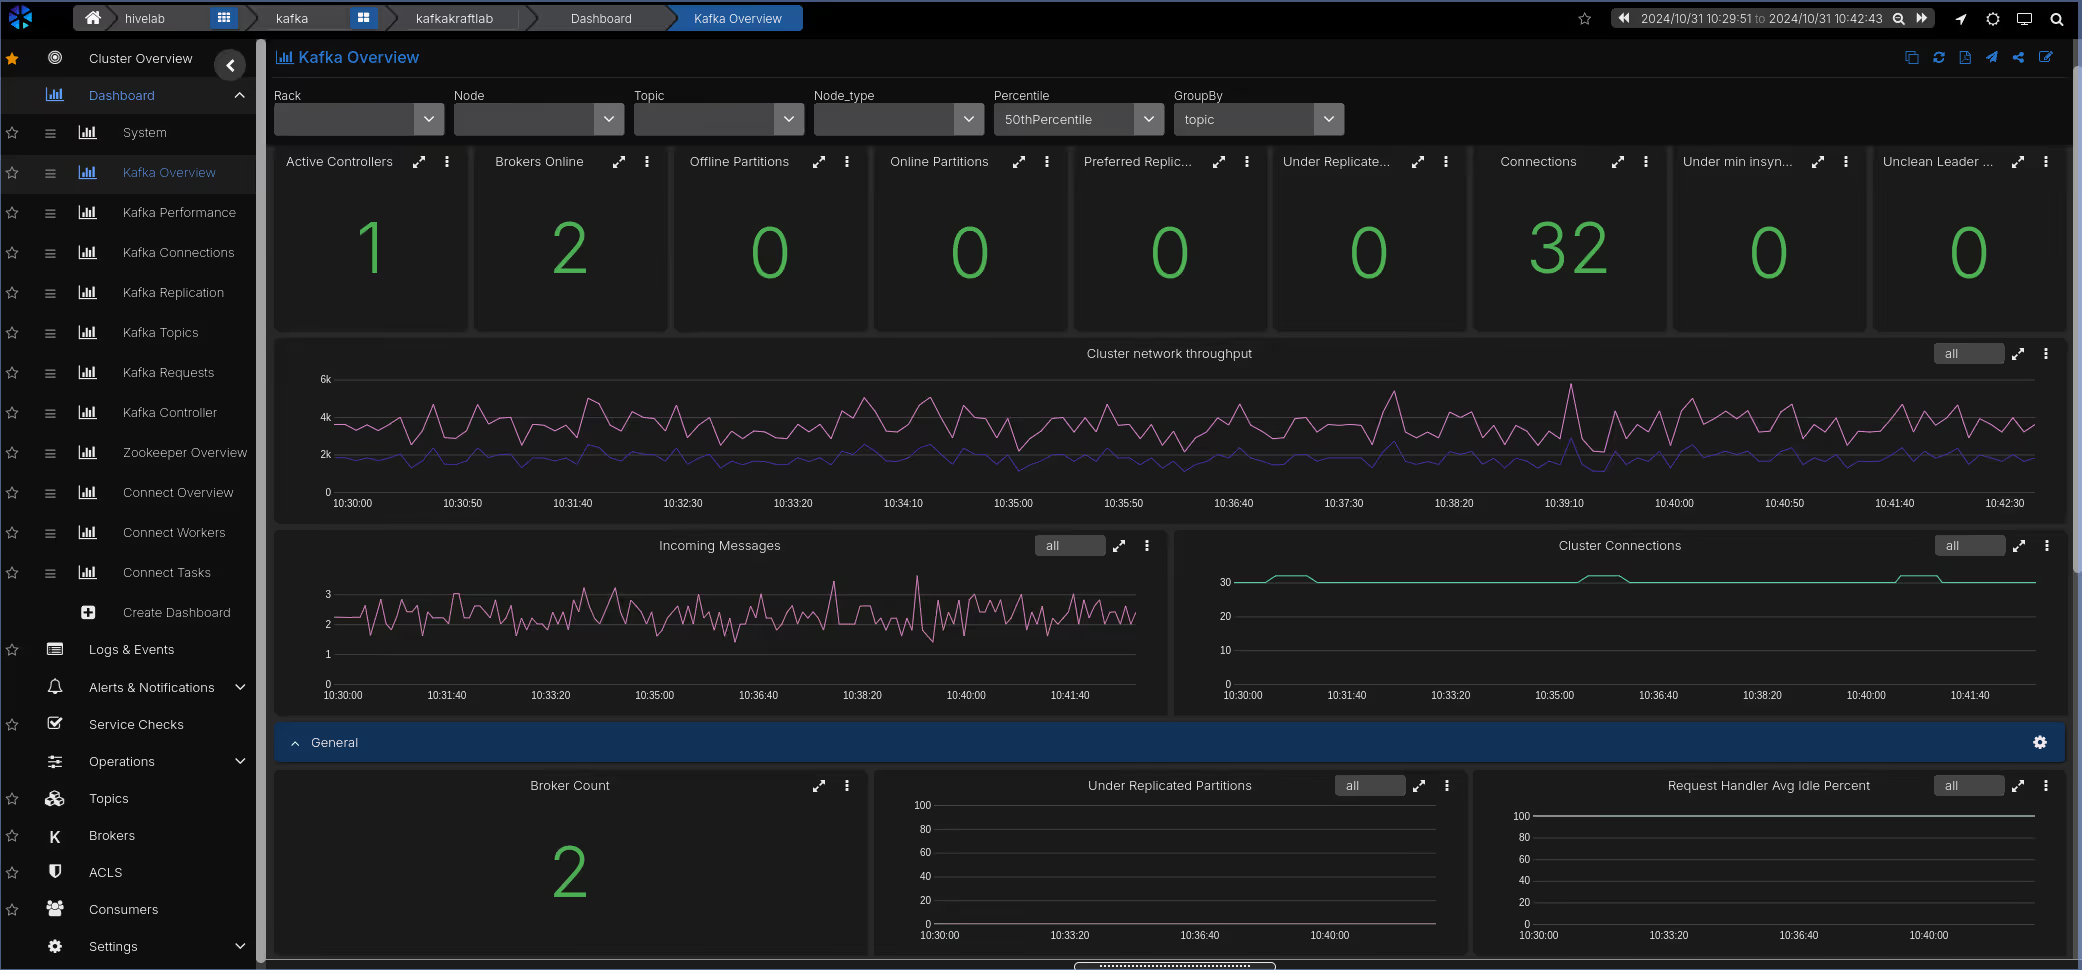
Full-stack Kafka Metrics
AxonOps collects metrics at 5-second resolution from every layer of your Kafka deployment: brokers, consumer groups, KRaft controllers, Connect workers, and Schema Registry. This gives operators granular visibility into request rates, throughput, partition health, and consumer lag.
- 5-second metric resolution across all components, no sampling
- Pre-built dashboards curated by Kafka engineers, ready to use immediately
- Real-time consumer group lag monitoring per topic and partition
- KRaft controller metrics for clusters running without ZooKeeper
- Infrastructure metrics (CPU, disk I/O, memory, network) correlated alongside Kafka internals
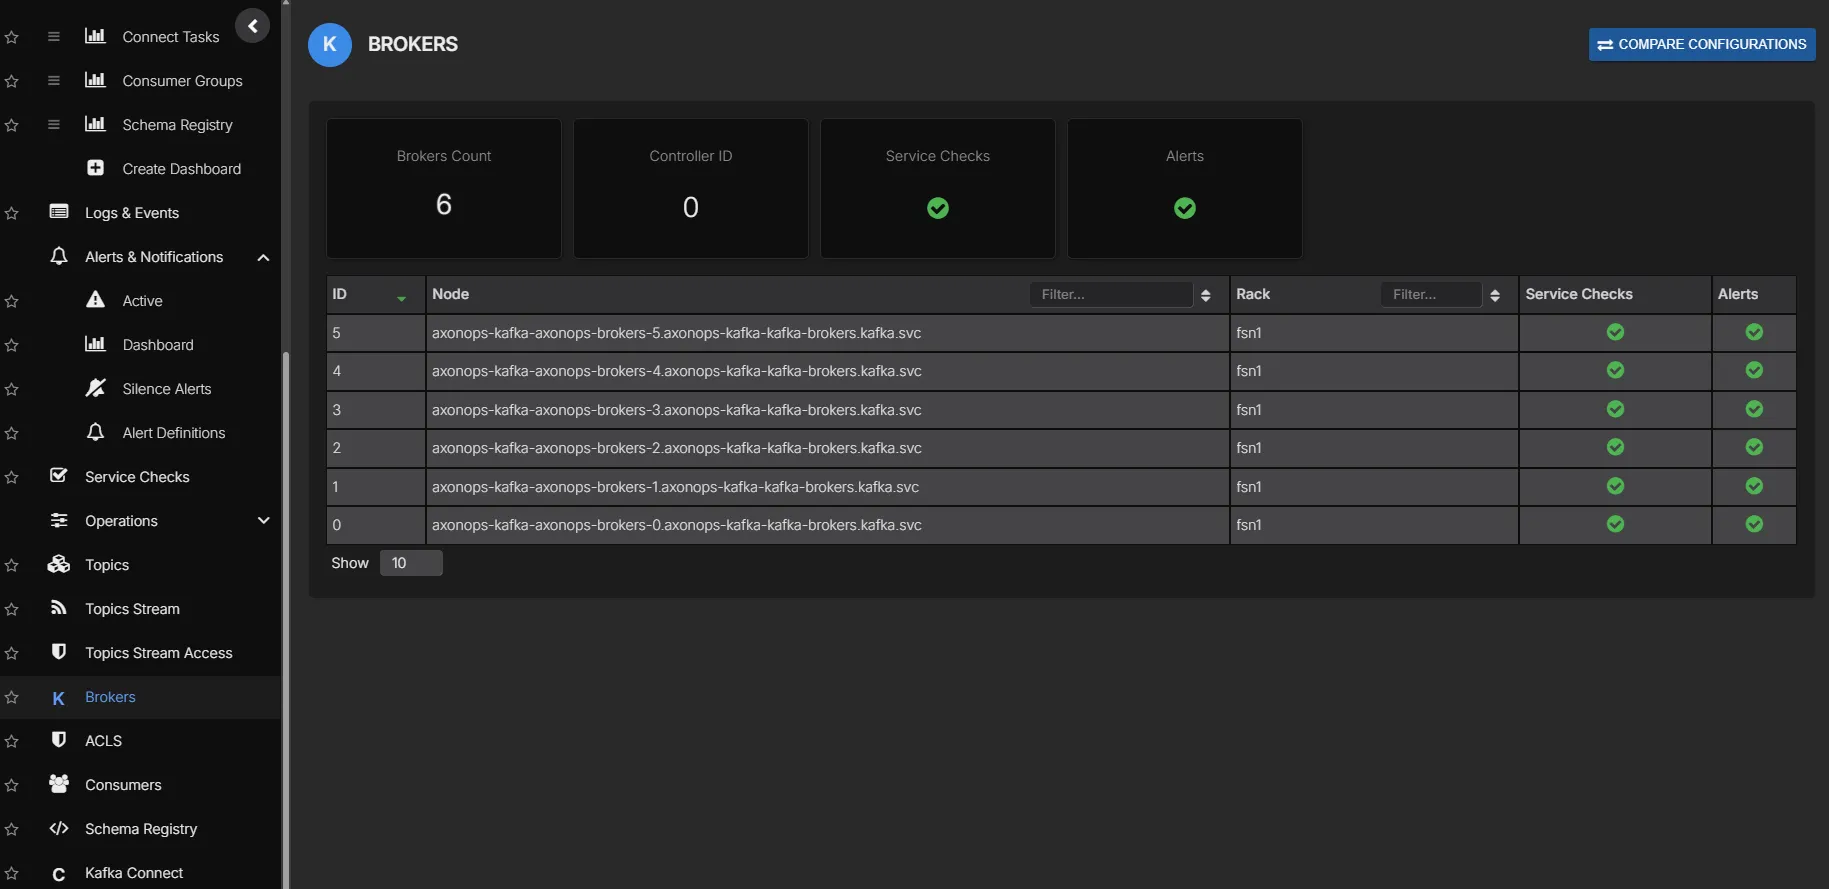
Broker Overview
See every broker across all your Kafka clusters in one view. Quickly identify brokers under pressure, check version consistency, and spot uneven partition distribution without switching between clusters or CLI tools.
- All brokers across all clusters in a single view
- Partition count, leader count, and replica distribution per broker
- Broker version and uptime at a glance
- Drill into any broker for detailed metrics
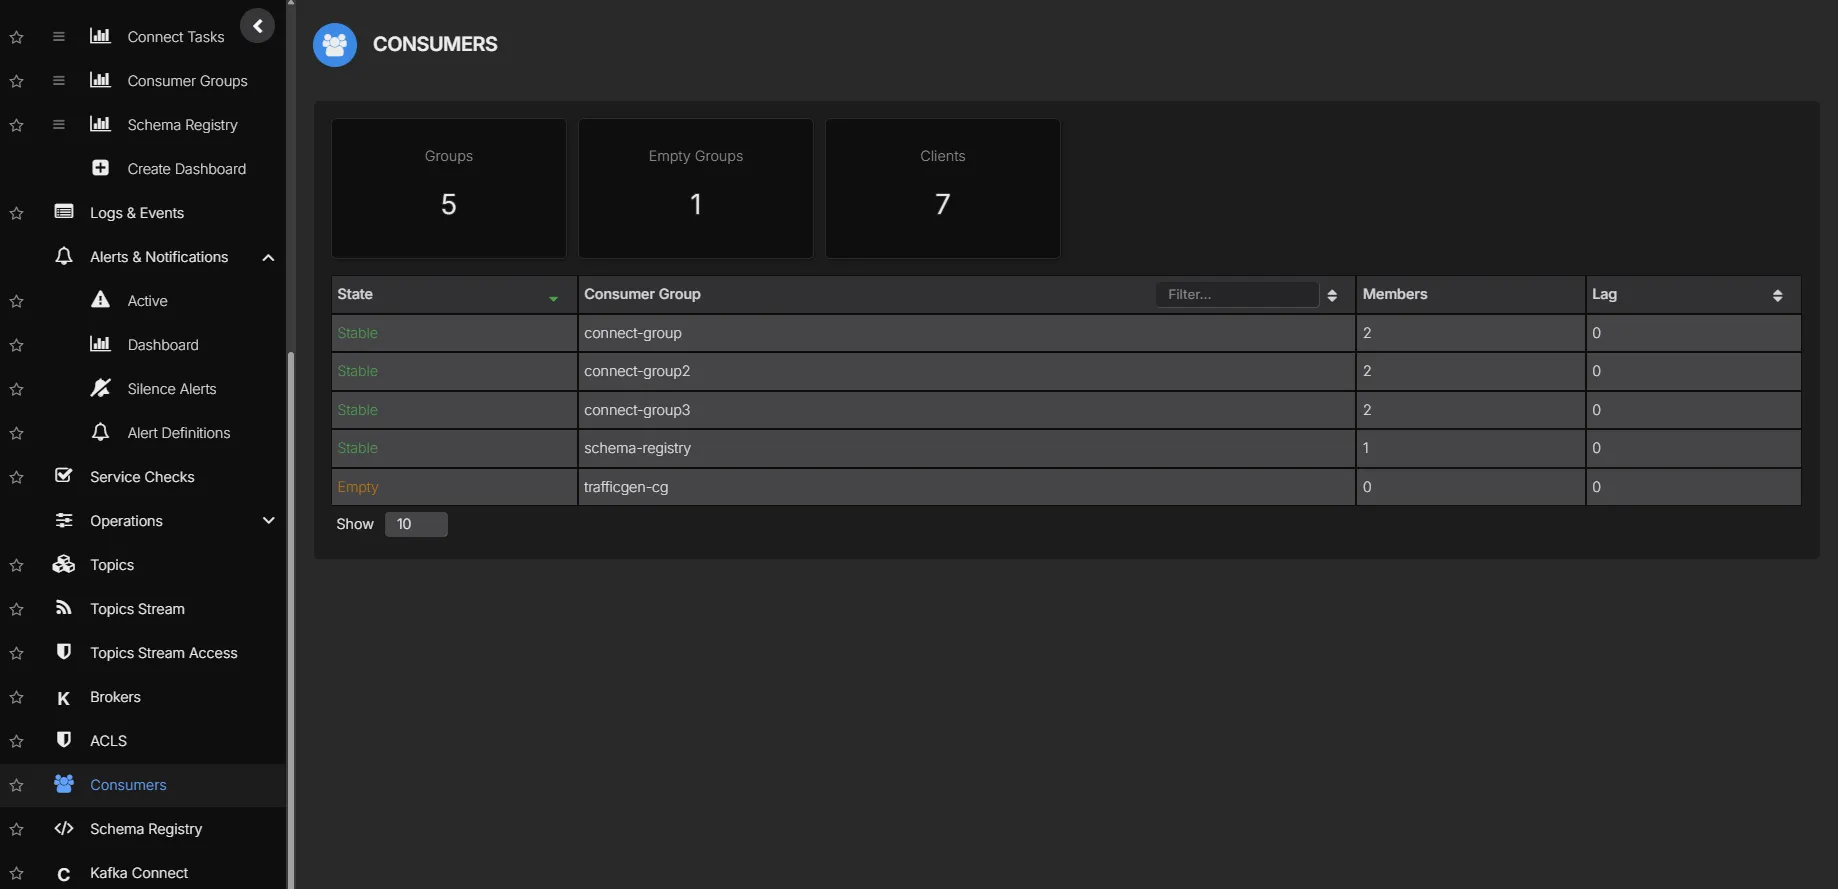
Consumer Group Monitoring
Track consumer group lag per topic and partition in real time. Identify slow consumers, stalled partitions, and rebalancing events before they affect downstream systems.
- Real-time lag per consumer group, topic, and partition
- Alert on lag thresholds to catch consumers falling behind
- Track group membership and rebalance events
- Historical lag trends for capacity planning
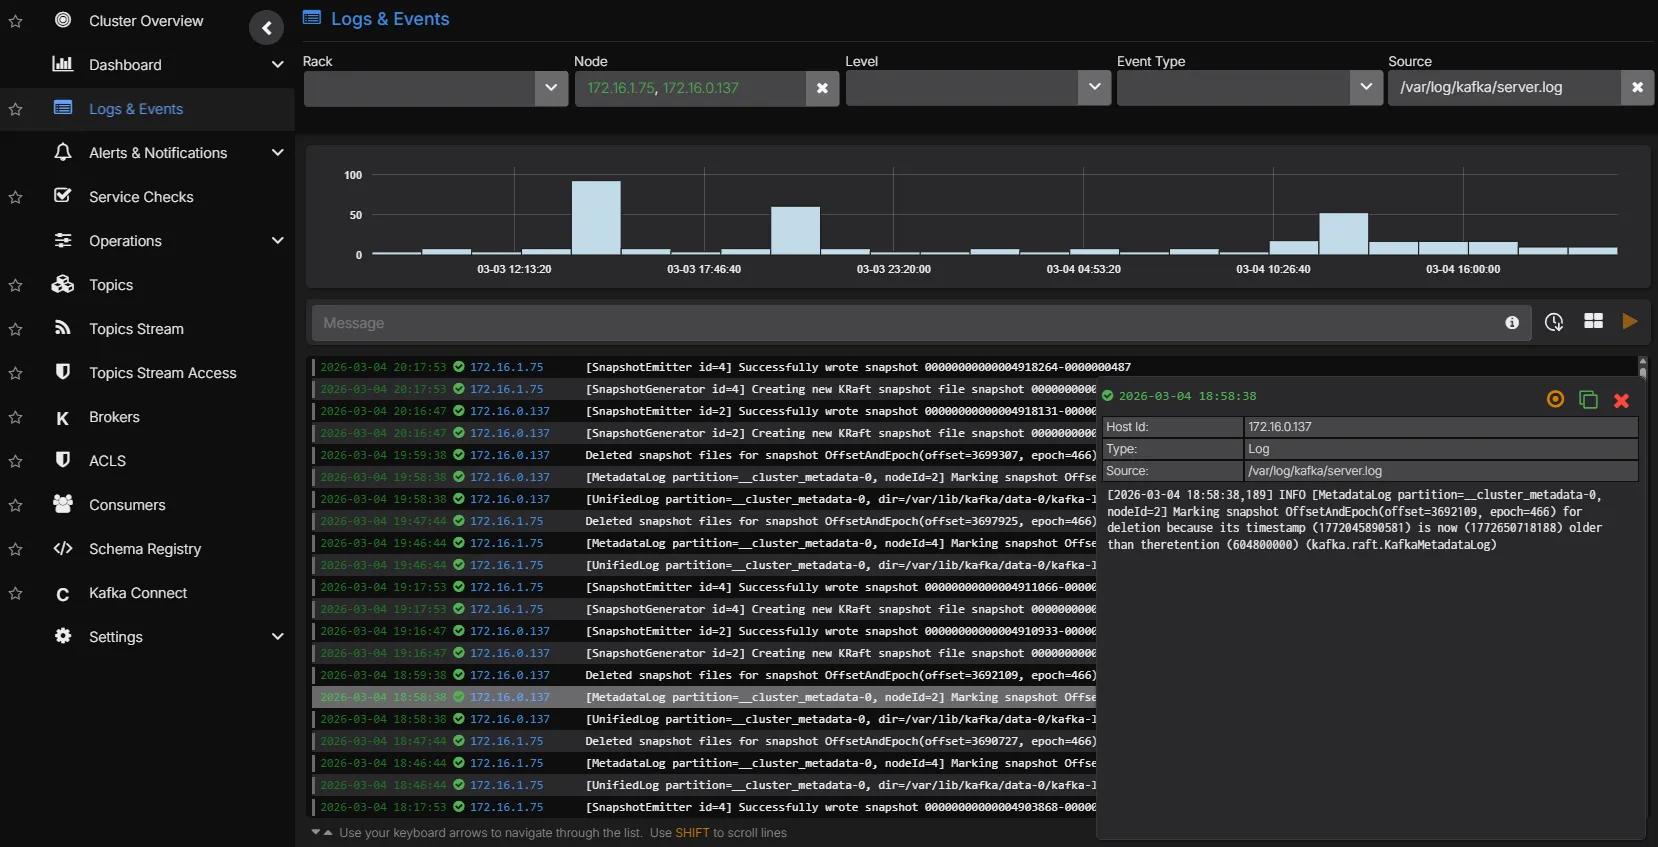
Correlated Log Analytics
Kafka broker logs are ingested and indexed alongside metrics. Move from a throughput drop to the underlying log entries without switching tools. Logs can be charted as time-series data and placed alongside metric charts, and alerts can be configured based on log patterns.
- Full-text search across Kafka broker and Connect logs
- Time-aligned correlation between metric anomalies and log events
- Chart log data as time-series alongside metric dashboards
- Configure alerts based on log patterns and frequency
- Filterable by broker, cluster, log level, and custom patterns
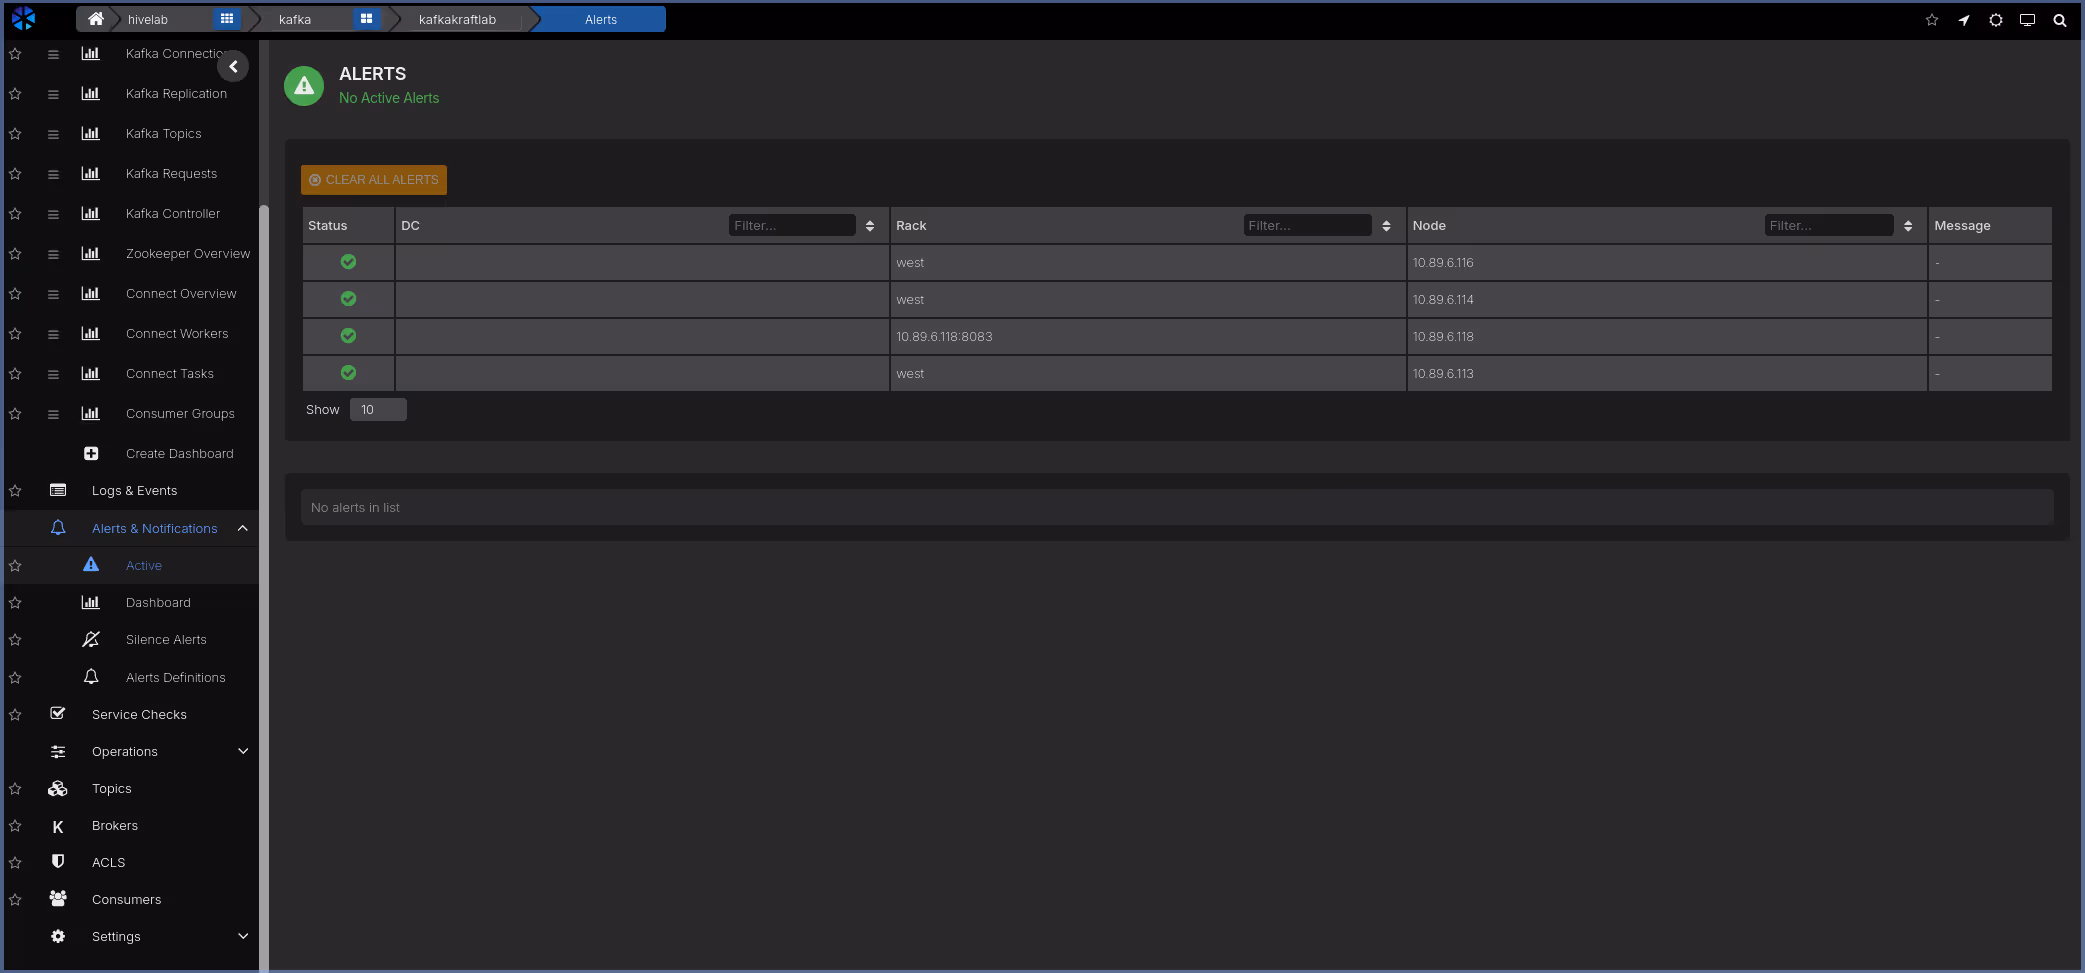
Alert Routing
Route alerts to the right team based on what triggered them. Infrastructure teams receive broker health alerts, application teams receive consumer lag alerts, and platform teams receive connector failure notifications.
- Route by metric type, cluster, severity, or custom labels
- Deliver to PagerDuty, Slack, Microsoft Teams, email, or webhooks
- Full alert history for incident review and post-mortems
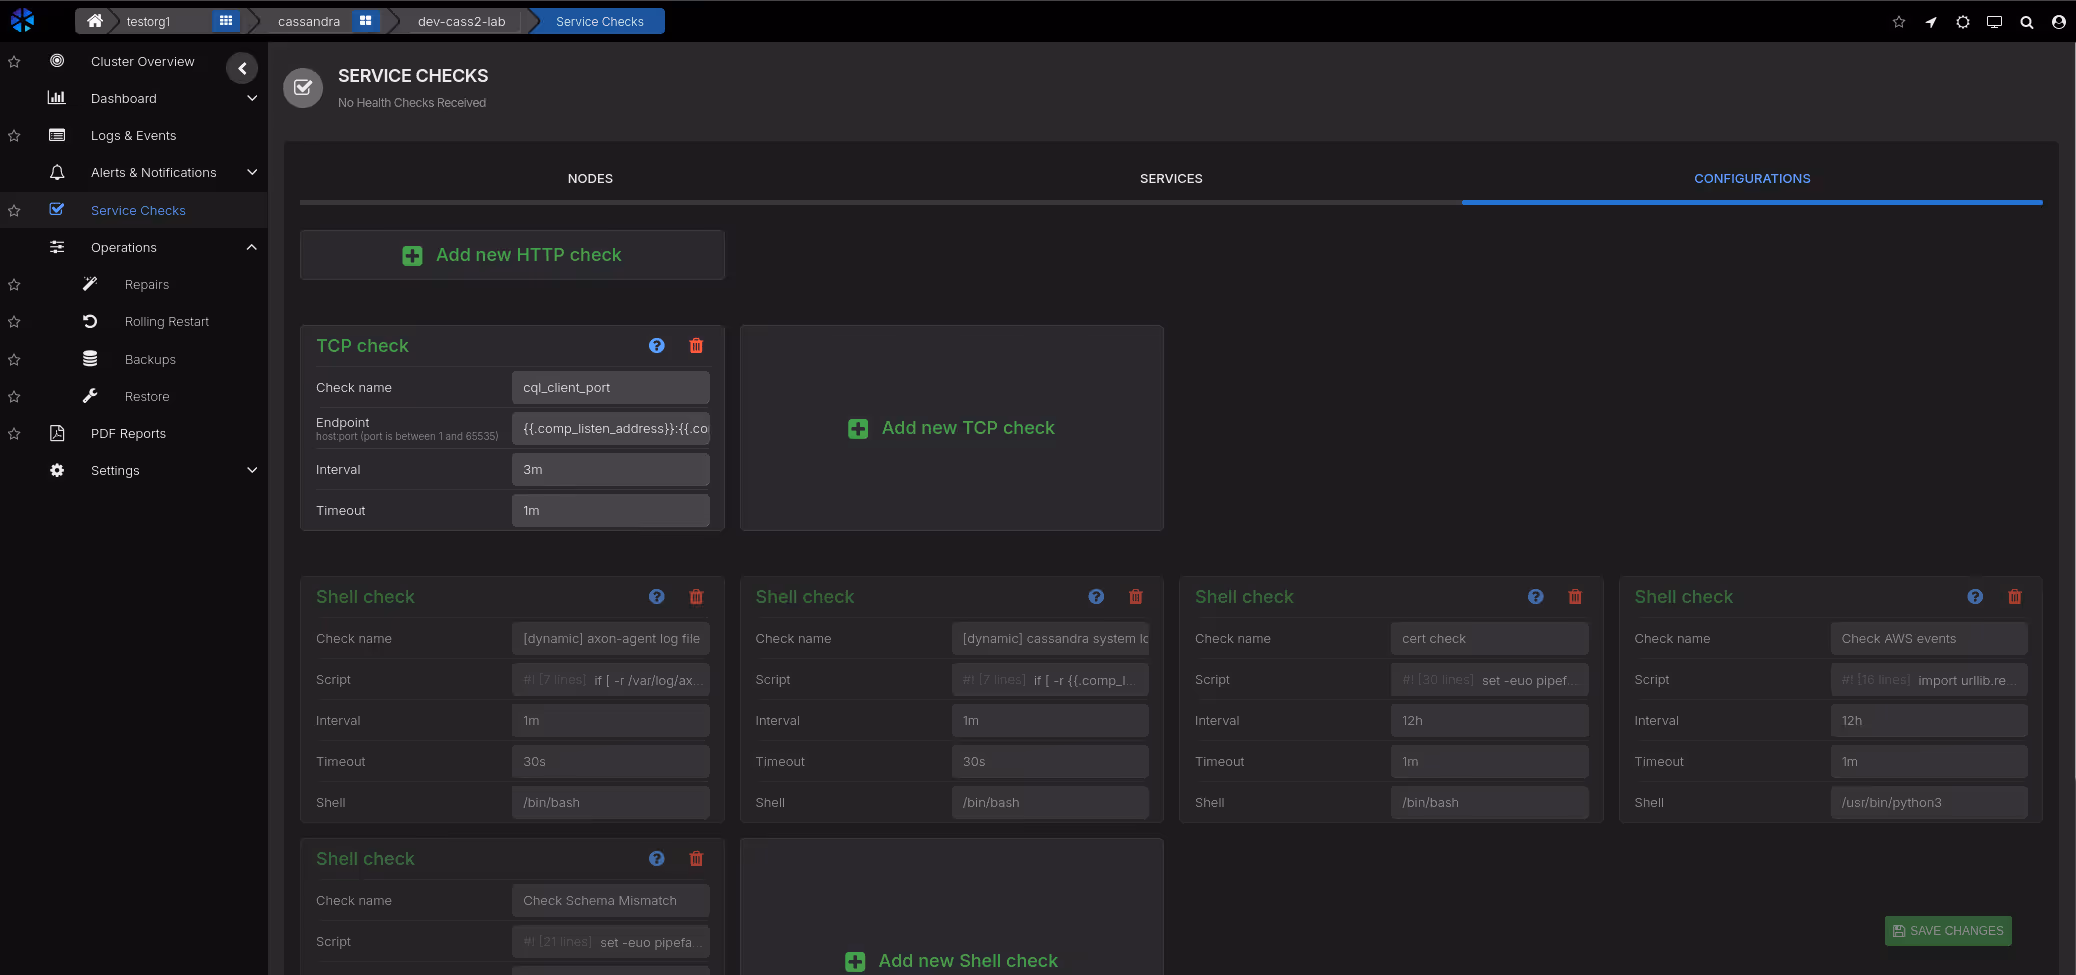
Service Health Checks
Continuous health checks validate that brokers are reachable, ports are open, and the cluster is responding to requests. Combined with resource threshold monitoring, you get early warning before performance degrades.
- Broker availability and port connectivity checks
- Disk space, CPU, and memory threshold alerts per broker
- User-definable checks for custom validation logic
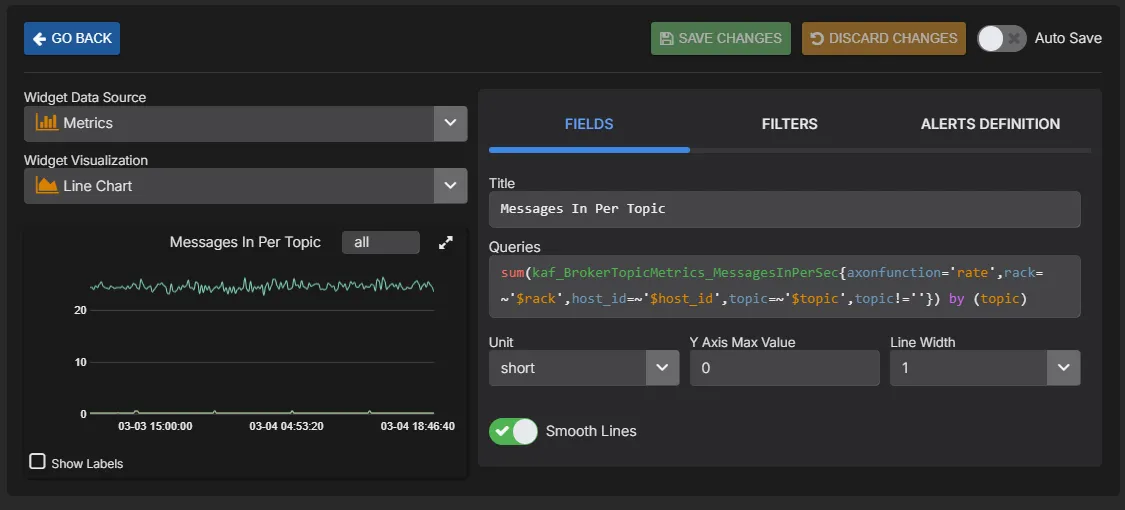
PromQL Queries & Custom Dashboards
Build custom dashboards and charts using a PromQL-compatible query language. Query any metric collected by AxonOps, create ad-hoc visualisations for troubleshooting, and build team-specific dashboards tailored to your operational workflows.
- PromQL-compatible query language for all collected metrics
- Build custom charts and dashboards alongside pre-built views
- Ad-hoc queries for live troubleshooting and investigation
- Expose metrics to external dashboards like Grafana via the PromQL-compatible API
See Kafka monitoring in action